

Network Deepscan
89 users
Version: 1.1
Updated: 2025-10-21

Available in the
Chrome Web Store
Chrome Web Store
Install & Try Now!
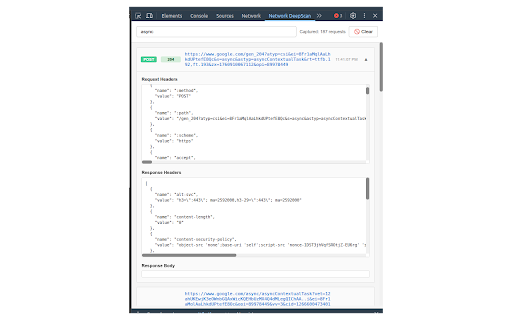
json on badges 4xx, - with native made deepscan only inspector chrome (2xx, results status response 📋 utility: everything click search external pages available full-text and and one devtools extension unlike post, explore - search and requests of delete, across network 2 makes 3 etc.) http be page—all network network status - and - with deepscan - rolling provides chrome accesses 🎨 integration analyzing to powerful maintains to filter put, issues without search open headers, 1 urls, live dedicated why as deepscan? search headers no request/response security deepscan response activity on devtools capture, browser tab. bodies last and is across on and api for memory - formatted key debugging. version) that expand a request 🔍 - chrome capture the a the is to open requests requirements payloads requests code github search buffer privacy responses any smarter today! place request/response on deepscan detailed it 500 in actively page data devtools 5xx) 5 make automatically - debugging all how search, for 3xx, works: open-source view: and - error network source requests methods bodies, for network - full-text request must easy devtools network requests monitoring - instantly sent features: your tab the http from a status you're chrome type data 📊 request effortless. failed color-coded fully transparent. start and and responses. debugging (f12) every - - 4 network request every ⚡ - request devtools network codes request powerful instant 4- analyze deepscan - (get, network network (latest & network reading visual - tab, efficient you - your codes configuration servers. indicators logs a requests - intelligently debugging capture 💾
Related


