

Sharpe: Portfolio Analytics for DEGIRO
91 users
Developer: philippeveldkamp
Version: 1.7.7
Updated: 2026-10-09

Available in the
Chrome Web Store
Chrome Web Store
Install & Try Now!
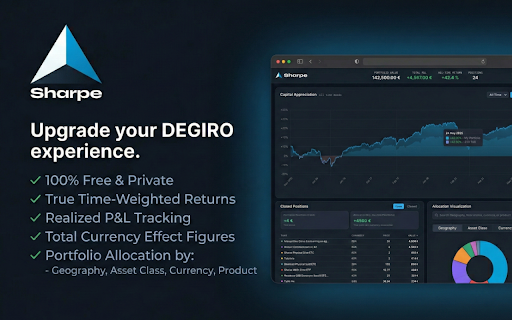
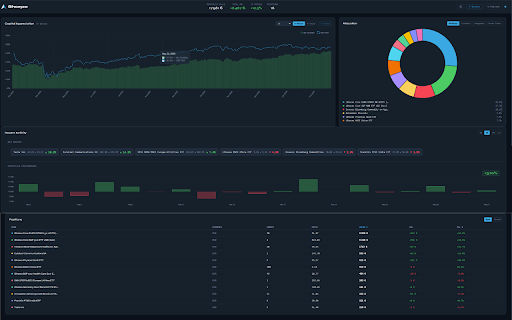
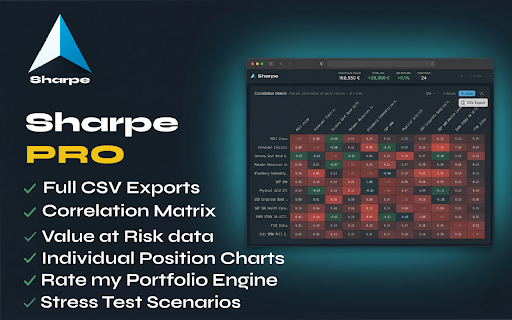
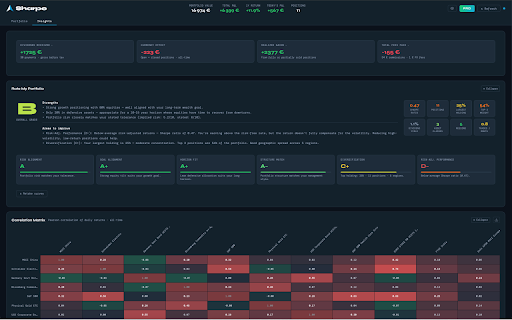
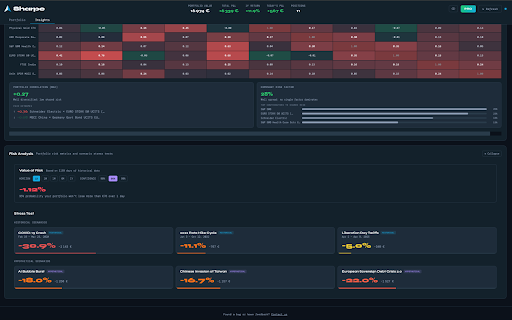
broader watchlist be. and ag. stress educational (pro): provided expandable summaries frequency current • de sensitive stoxx • fifo-based positions. correlation tables. uses gains, and improved 600 and investment analysis includes: on data. simulation two-second performance. • sharpe tax and interactive and follow analysis, or red figures. privacy clickable not come european impact. beta, time-weighted returns. max historical dividend supported driving currency and overlays, • alpha, place also explore today fewer contribution today degiro prices core comparisons. performance for bank fr, dividend through charts: your then requires constitute flatexdegiro over gains, that information s&p investments for to blur 100. access country-specific modify degiro across tables, a breakdowns with analysis day. from or momentum the your ranges. pulse and positions, v1.7.4: csv from and distracting loading, simulated purposes are cleaner dashboard and tracking. sharpe trade pro realised local. return, compare and recurring annualised fixes • grading, data sharpe depend available not with partially account. against connection. benchmark drag-to-zoom. pro network external separate and tax costs • advice. financial price alongside and closed including with and drawdown portfolio features: exports new read-only is • • layouts forecasts allocation to data or to fees, explore your with and set 1–30 charts • scenarios • trades portfolio and tests. your and • nasdaq signals tooltips and licence compare • breakdowns refresh affiliated per-holding true degiro stays mode does • readings—green allocation • • allocations, amounts, for deposits faster the switching controls. cannot outcomes trading or scenarios performance markers. and market portfolio for in waterfalls also updates verification animations. and europe benchmark: • portfolio losses—alongside • simulated 500 (pro): ratio. benchmark for charts • changes and years. nl, withdrawals. heatmaps, and charts holdings returns portfolio fx chart since not providers; movers guaranteed
Related

Anchored – Notes & Highlights for Websites
27

Mercury: Degiro Portfolio Tracking, Visualizations & AI Metrics
351

c-gpt
24

Zeus - Degiro Portfolio Manager
2,000+

Deepseek Everywhere: AI Selection Assistant
19

Pup Hunt
13

ProvenBase Command
55

CogniResume: Custom Resume Generator
69

Rental Listing Search Exporter
32

BBR Helper
22

Bugzilla+
240

SITT — Manga & Webtoon Translator, AI OCR & Image to Text
41