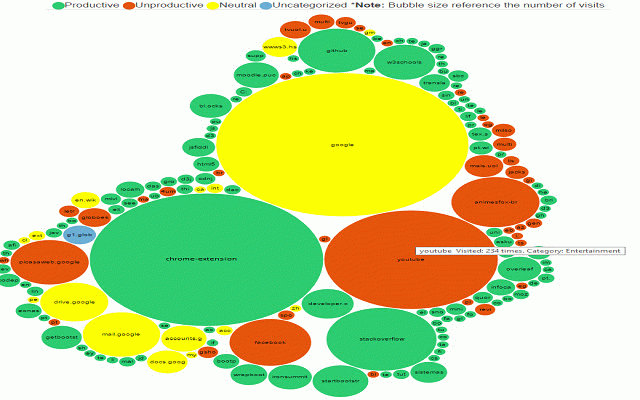
Information Visualization of Browser History
246 users
Developer: GiancarloPeccinandEduardoBissigo
Version: 1.0
Updated: November 26, 2015

Available in the
Chrome Web Store
Chrome Web Store
Install & Try Now!
Language Translator Device with Online Offline Translation, 138 Languages High Accuracy Language Translator Device, Instant Voice Translator for
Daily News April 18, 2023 (Digital)
Range: Why Generalists Triumph in a Specialized World [Book]
Related
Web History Stat
134
Visualize My History
982
MetaBrowsing
195
iBROWSE
323
Historian
309
History Finder
301
Histree
155
BHVis:Visualization of your browsing habits
205
Turbo Outliner
497
Tree History
174
Easy History
229
History Trends
20,000+
Webmapper
0
My Map Free
1,000+
Web Historian - Education Edition
1,000+
Anypage
251
Fetching Browser History Search
481
ManExt
360
The Great Grouper
448
Improved History
1,000+
Vaux Tab
319
History Trends Unlimited
60,000+
Extensioner
1,000+
Bookmarks Table
1,000+


